> For the complete documentation index, see [llms.txt](https://helpdesk.smaply.app/llms.txt). Markdown versions of documentation pages are available by appending `.md` to page URLs; this page is available as [Markdown](https://helpdesk.smaply.app/integrations/how-to-manage-integrations-at-account-level.md).

# How to manage integrations

Smaply keeps every connected tool in one place. From the **Integrations** tab in **Account Settings**, an Admin can see what's connected, disconnect a tool, or switch how a metrics tool authenticates.

{% hint style="info" icon="clipboard-list" %}

#### In this guide

1. [Find your integrations](#find-your-integrations)
2. [Connection states](#connection-states)
3. [Disconnect an integration](#disconnect-an-integration)
4. [Switch authentication method](#switch-authentication-method)
5. [Refresh and plan availability](#refresh-and-plan-availability)
   {% endhint %}

{% hint style="warning" icon="list-check" %}

#### Prerequisites

You need the Admin role at the account level to view or change integrations. Editors cannot configure integrations.
{% endhint %}

#### Find your integrations

In Smaply, go to **Account Settings > Integrations**. The **Manage integrations** page lists every tool Smaply connects to, grouped into two sections:

* **Metrics integrations** - Google Analytics, Office 365 Excel, Power BI, Google Sheets, and Qualtrics. These feed live data into journey map metric cards.
* **Planning integrations** - Jira, Azure DevOps, Asana, Linear, Trello, and Monday.com. These let you link work items onto planning cards.

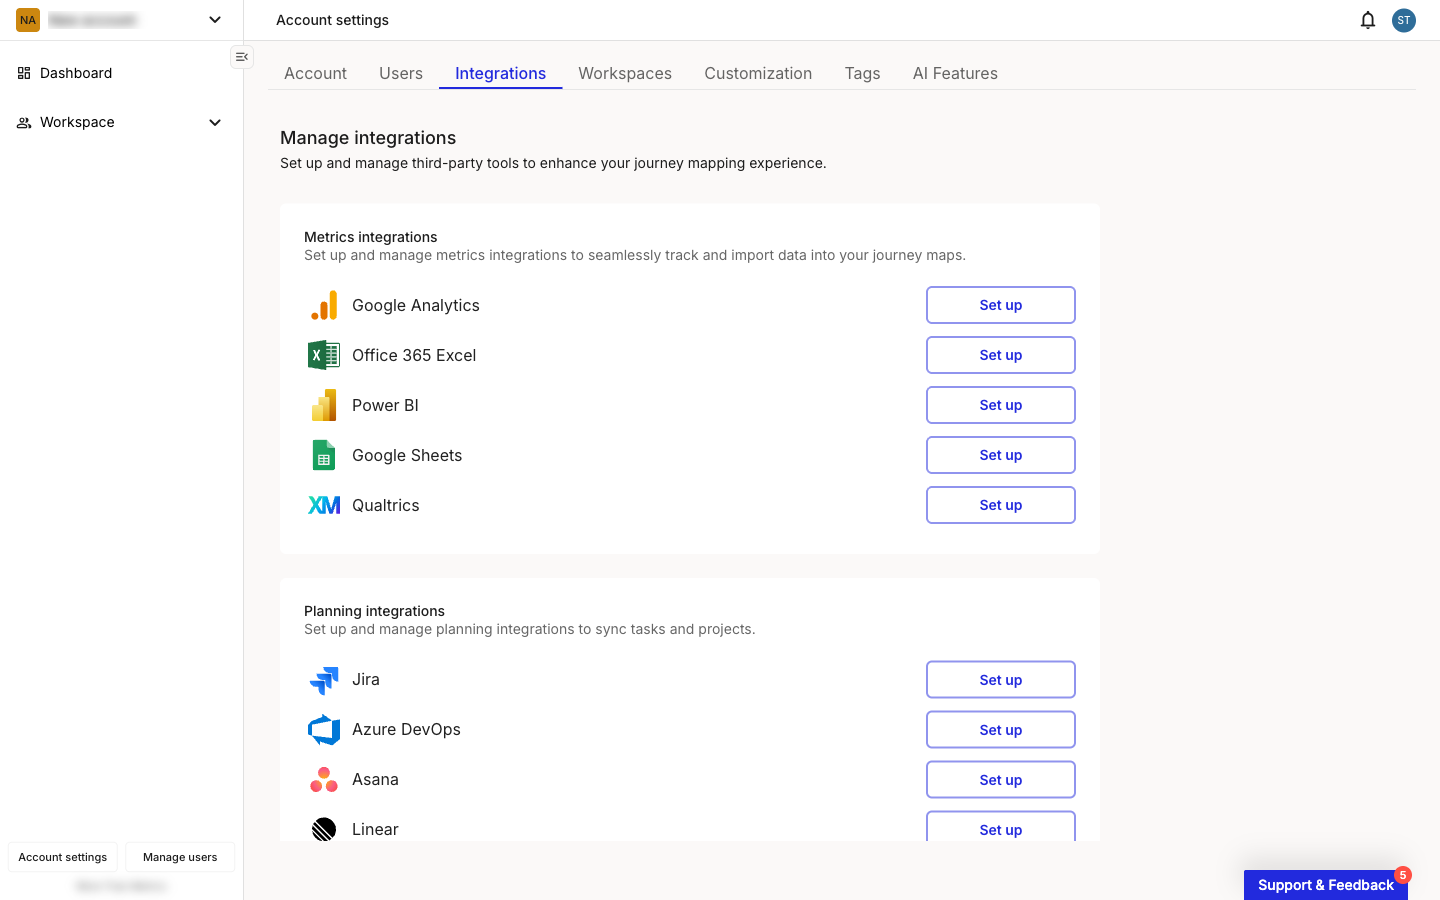
Each row shows the tool's current state. A tool you haven't connected yet shows **Set up**; a connected tool shows **Edit**.

<figure><img src="/files/eB6zAk4d86spcjHZVwE1" alt="Smaply Account settings with the Integrations tab open on the Manage integrations page. The Metrics integrations section lists Google Analytics, Office 365 Excel, Power BI, Google Sheets, and Qualtrics, and the Planning integrations section lists Jira, Azure DevOps, Asana, and Linear. Every row shows a Set up button."><figcaption><p>Account Settings > Integrations, nothing connected yet</p></figcaption></figure>

***

#### Connection states

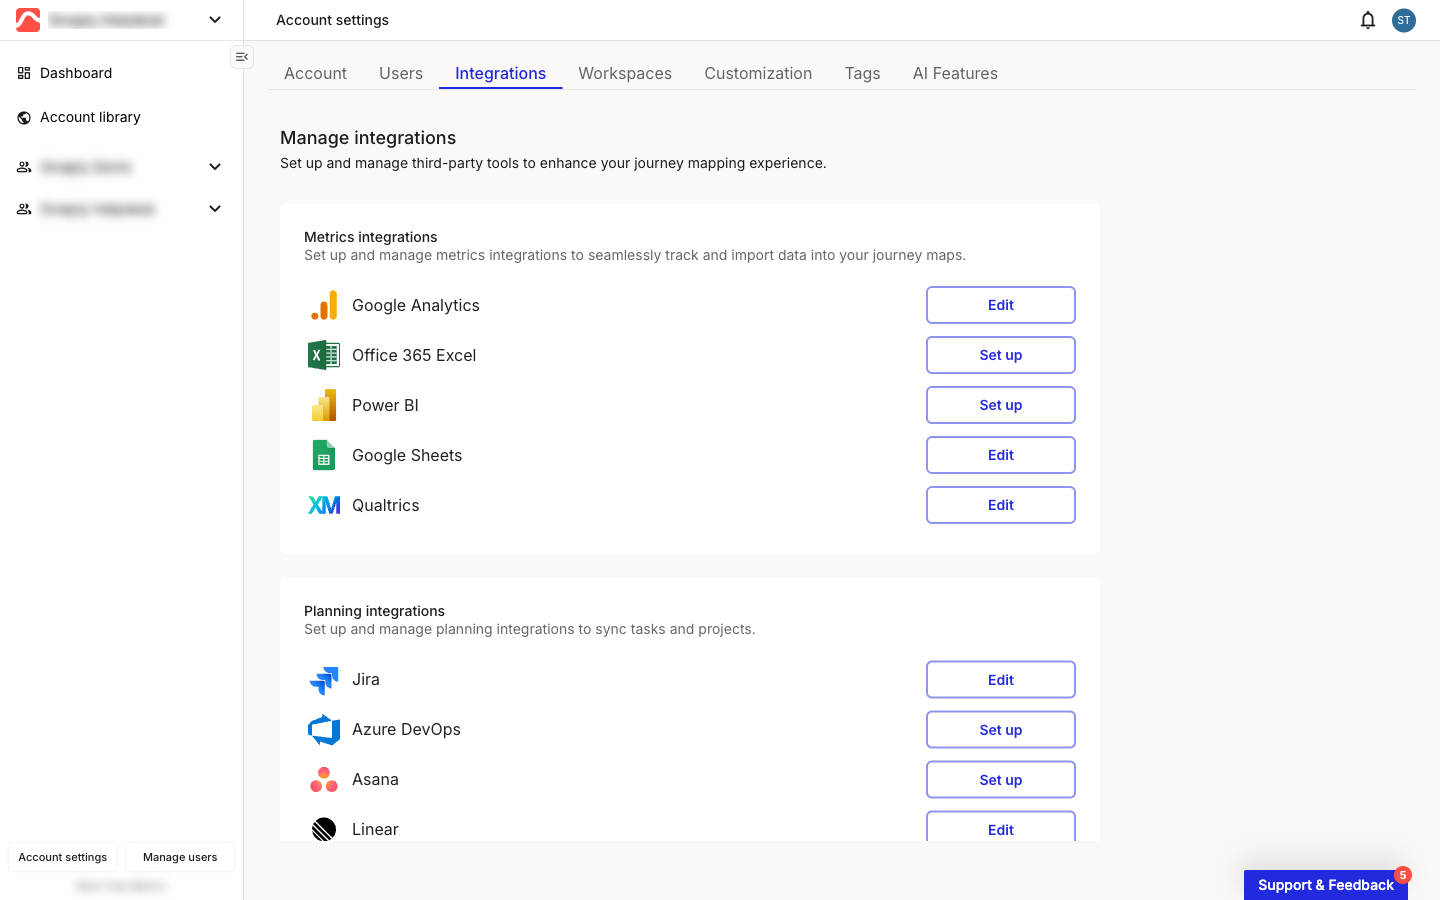
A connected tool shows **Edit** in its row. Open it to see a green confirmation that reads "Successfully connected to {Tool}", the credentials you saved (masked), and the date and person who connected it. From here you can change the connection or remove it.

<figure><img src="/files/uYzC34ml6kLtrkZ64FPA" alt="The Manage integrations page with a mix of states. Google Analytics, Google Sheets, and Qualtrics show an Edit button; Office 365 Excel and Power BI show Set up. In the Planning integrations section, Jira and Linear show Edit while Azure DevOps and Asana show Set up."><figcaption><p>A mix of connected and unconnected tools</p></figcaption></figure>

A tool you haven't connected shows **Set up** and opens to an empty configuration form with instructions for collecting the credentials you need. To connect one, follow its setup guide under [Metrics tools](/integrations/metrics-tools.md) or [Planning tools](/integrations/planning-tools.md).

If a connection fails, the tool's page shows a red banner instead of the green confirmation. See the Troubleshooting section in the tool's own setup guide for how to fix it.

***

#### Disconnect an integration

Disconnecting removes the saved credentials and stops Smaply pulling data from that tool. Metric and planning cards built on it stop updating until you reconnect.

{% stepper %}
{% step %}
**Open the tool**

Go to **Account Settings > Integrations** and click **Edit** next to the connected tool.
{% endstep %}

{% step %}
**Remove the connection**

Click **Delete Configuration**. For tools you connected through OAuth, such as Google Sheets, this action reads **Disconnect account** instead.
{% endstep %}

{% step %}
**Confirm**

The row returns to **Set up**, ready to connect again whenever you need it.
{% endstep %}
{% endstepper %}

***

#### Switch authentication method

Google Analytics, Power BI, Google Sheets, and Office 365 Excel each offer two ways to connect: a **Service account** shared across your team, or **OAuth** tied to one person's login. You can switch between them, but doing so disconnects the current connection first. Smaply warns you before you proceed.

{% stepper %}
{% step %}
**Open the tool**

Go to **Account Settings > Integrations** and click **Edit** next to the tool.
{% endstep %}

{% step %}
**Pick the other method**

Select the authentication method you want. Smaply tells you that switching will disconnect the current connection.
{% endstep %}

{% step %}
**Reconnect**

Confirm, then connect with the new method. For setup details, see the tool's guide under [Metrics tools](/integrations/metrics-tools.md).
{% endstep %}
{% endstepper %}

Qualtrics and all planning tools use a single authentication method, so there's nothing to switch.

***

#### Refresh and plan availability

You connect each tool once at the account level, and the connection applies to your whole account rather than to a single workspace.

Metrics integrations don't stream data continuously. A metric refreshes when you open it if its last update is more than about an hour old, so figures stay current without a manual refresh. Planning cards reflect the live status of each item in the source tool.

{% hint style="info" icon="tag" %}

#### Plan availability

Service account authentication for Power BI, Google Analytics, and Office 365 Excel requires the **Governance** plan, as does Qualtrics. Google Sheets and all planning integrations are available on every plan.
{% endhint %}

#### Related topics

<table data-view="cards"><thead><tr><th>Article</th><th>What it covers</th><th data-hidden data-card-target data-type="content-ref">Target</th></tr></thead><tbody><tr><td><strong>Set up your first integration</strong></td><td>Connect your first tool and find each tool's setup guide</td><td><a href="/pages/MnIIaFvymKzpE7B98hdU">/pages/MnIIaFvymKzpE7B98hdU</a></td></tr><tr><td><strong>Create and configure a metric</strong></td><td>Turn connected metrics data into a journey map metric card</td><td><a href="/pages/UlZ0vwT23WaSlpB6ae7r">/pages/UlZ0vwT23WaSlpB6ae7r</a></td></tr><tr><td><strong>Use planning cards</strong></td><td>Link work items from a connected planning tool onto a journey map</td><td><a href="/pages/8b7Oqz3iQ0er7DHD7TSo">/pages/8b7Oqz3iQ0er7DHD7TSo</a></td></tr><tr><td><strong>Set up Qualtrics</strong></td><td>Connect Qualtrics so survey data flows into metric cards</td><td><a href="/pages/qSgT2h9D9cKZgrZCWRx3">/pages/qSgT2h9D9cKZgrZCWRx3</a></td></tr></tbody></table>


---

# Agent Instructions
This documentation is published with GitBook. GitBook is the documentation platform designed so that both humans and AI agents can read, navigate, and reason over technical content effectively. Learn more at gitbook.com.

## Querying This Documentation
If you need additional information that is not directly available in this page, you can query the documentation dynamically by asking a question.

Perform an HTTP GET request on the current page URL with the `ask` query parameter, and the optional `goal` query parameter:

```
GET https://helpdesk.smaply.app/integrations/how-to-manage-integrations-at-account-level.md?ask=<question>&goal=<endgoal>
```

`ask` is the immediate question: it should be specific, self-contained, and written in natural language.
`goal` is optional and describes the broader end goal you are ultimately trying to accomplish on behalf of the user. GitBook uses it to tailor the answer towards what is most useful for that goal.

The response will contain a direct answer to the question and relevant excerpts and sources from the documentation.

Use this mechanism when the answer is not explicitly present in the current page, you need clarification or additional context, or you want to retrieve related documentation sections.