> For the complete documentation index, see [llms.txt](https://helpdesk.smaply.app/llms.txt). Markdown versions of documentation pages are available by appending `.md` to page URLs; this page is available as [Markdown](https://helpdesk.smaply.app/journey-maps/cards/how-to-use-metric-cards.md).

# How to use metric cards

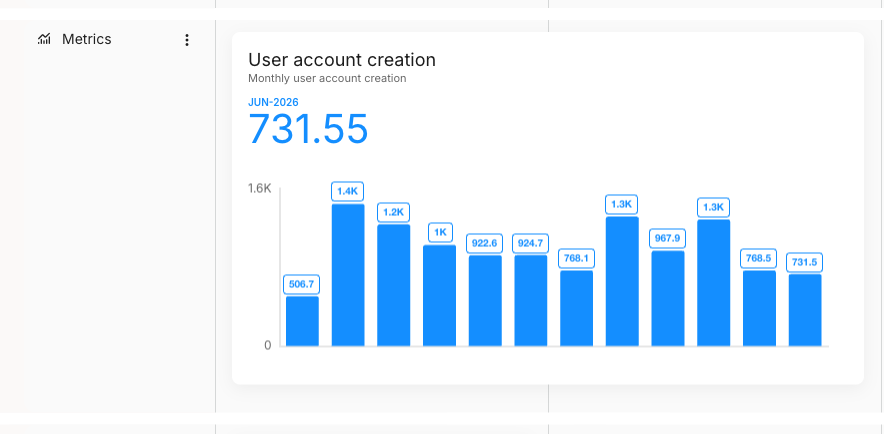
A metric card surfaces a metric on a journey map: a number or a chart that updates from its data source, like monthly user account creation or a conversion rate next to the step it relates to. The metric is the data; the card is how that data appears, and the same metric can sit on as many maps as you like.

<figure><img src="/files/0pngpm5tCiPhzkQeZn7h" alt="A journey map lane labelled Metrics holding a metric card titled User account creation, with the subheading Monthly user account creation, a JUN-2026 period label, a large value of 731.55, and a bar chart of monthly values below it."><figcaption><p>A metric card showing a value and chart on the map</p></figcaption></figure>

To add one, hover an empty cell and click **+ Add card**, then choose **Metric**. It sits under **ADVANCED CARDS** in the picker. A metric card shows existing metric data rather than typed content, so adding one opens the **Add metric** picker straight away.

{% hint style="info" icon="tag" %}
Metric cards are an advanced card type. On the **Free** and **Repository** plans you can add up to 3 advanced cards per map. Advanced cards are unlimited from the **Framework** plan.
{% endhint %}

***

#### How to add a metric to the card

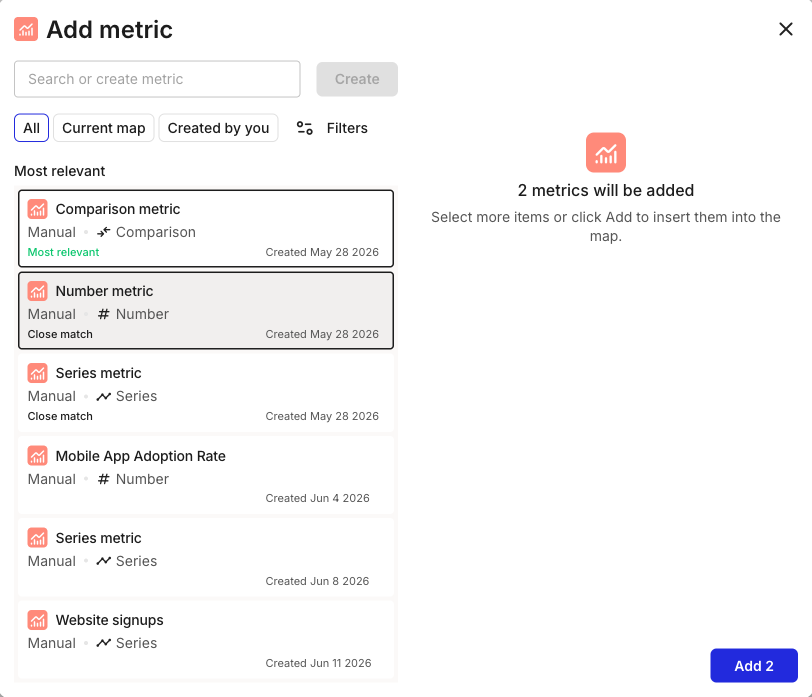
When you add a metric card, the **Add metric** picker opens. From here you either reuse a metric that already exists or create a new one.

<figure><img src="/files/dMzB1vN9mnK1y2ffeaOk" alt="The Add metric picker. A Search or create metric field with a greyed-out Create button sits at the top, with All, Current map, and Created by you filters and a Filters control. A Most relevant list of existing metrics follows, each with its source (Manual), a type label (Comparison, Number, or Series), and a created date; two metrics, Comparison metric and Number metric, are selected. The right pane reads 2 metrics will be added, select more items or click Add to insert them into the map, above a blue Add 2 button."><figcaption><p>Add metric picker: select one or several metrics, then click Add</p></figcaption></figure>

* **Reuse an existing metric** - The picker lists the metrics in your workspace, each with its source and type. Type in **Search or create metric** to narrow the list, or use the **All**, **Current map**, and **Created by you** filters. Click a metric to select it, or pick several to add them in one go, then click **Add**. When you select more than one, the button shows the count, like **Add 2**. Because one metric can appear on many maps, reusing it keeps every card in sync with the same data.
* **Create a new one** - Type a name in **Search or create metric** and click **Create**. This opens the metric builder, where you pick the data source and metric type and map its fields.

Creating a metric, choosing its source (Manual, a CSV upload, or an integration like Google Analytics or Qualtrics), its type (Number, Series, or Comparison), and its fields, is its own task. See [How to create and configure a metric](/metrics/how-to-create-and-configure-a-metric.md) for the full walkthrough.

***

#### How to change how the metric displays on this card

Each card holds its own display of the metric, so the same metric can show as a number on one map and a chart on another. Open that display from the card to change the chart type, headings, and other display options.

{% stepper %}
{% step %}
**Select the card and click Edit metric**

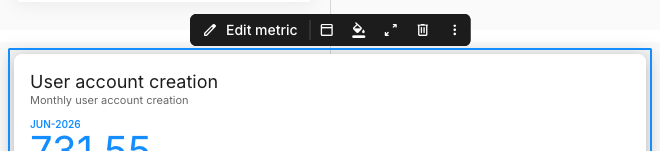
Click the card once to select it, then click **Edit metric** on the floating toolbar. **Edit metric** is the leftmost button; the rest of the toolbar is shared with every card type.

<figure><img src="/files/JORkzByUzfdub4KCOcYB" alt="The floating toolbar for a selected metric card titled User account creation. From left: an Edit metric button with a pencil icon and label, then a card header icon, a fill (paint bucket) icon, a show card details icon, a delete icon, and a three-dot overflow menu."><figcaption><p>Edit metric is the leftmost button on the metric card toolbar</p></figcaption></figure>
{% endstep %}

{% step %}
**Adjust the display and save**

The metric builder opens with the data on the left and a live preview of the card on the right. Set the chart type and any headings here, then save. For what each option does and how the data source feeds the card, see [How to create and configure a metric](/metrics/how-to-create-and-configure-a-metric.md).
{% endstep %}
{% endstepper %}

{% hint style="info" %}
A metric card saves through the metric builder, not as you type on the card. Editing a metric updates every card that displays it, across all your maps.
{% endhint %}

***

#### What the card details panel shows

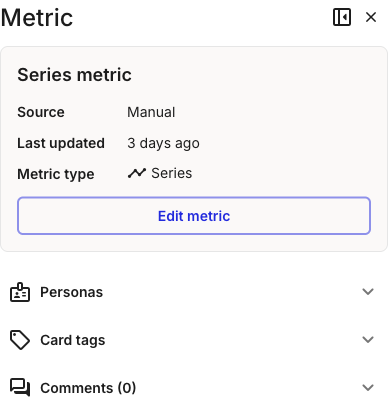
Open the card details panel to see where the metric comes from and when it last updated. Select the card and click **Show card details** on the toolbar, or double-click the card.

<figure><img src="/files/s8MtSXcssjddslPbDVeM" alt="The metric card details panel headed Metric. A boxed section titled Series metric lists Source set to Manual, Last updated set to 3 days ago, and Metric type set to Series, above an Edit metric button. Below sit the collapsed Personas, Card tags, and Comments sections."><figcaption><p>The metric card details panel, with Source, Last updated, and Metric type</p></figcaption></figure>

The panel headed **Metric** names the metric and shows three read-only fields: **Source** (where the data comes from, such as Manual or an integration), **Last updated** (when the data last refreshed), and **Metric type** (Number, Series, or Comparison). An **Edit metric** button opens the same builder as the toolbar. Below those sit the universal **Personas**, **Card tags**, and **Comments** sections shared by every card type.

***

#### When the metric refreshes

A metric connected to an integration refreshes on load when its last update is more than roughly an hour old, so opening a map after a while pulls current data. There's no separate refresh button to press. The **Last updated** time in the card details panel tells you how fresh the data is.

***

#### What metric cards share with other cards

The metric, the **Edit metric** button, and the **Source** / **Last updated** / **Metric type** fields are what's specific to a metric card. Everything else on it is shared with every other card type:

* Accent colour, background style, and card header (the fill control and the buttons after it on the toolbar)
* Card details panel for personas, tags, and comments
* Duplicate, expand, shrink, and delete from the three-dot menu
* Multi-select with Shift+click

See [How to add and edit cards](/journey-maps/cards/how-to-add-and-edit-cards.md) for the canonical walkthrough of these mechanics. To put a metric card in its own lane, see [How to add and manage lanes](/journey-maps/lanes/how-to-add-and-manage-lanes.md).

***

#### Related topics

<table data-column-title-hidden data-view="cards"><thead><tr><th>Title</th><th>Description</th><th data-hidden data-card-target data-type="content-ref">Target</th></tr></thead><tbody><tr><td><strong>How to create and configure a metric</strong></td><td>Build a metric: pick a source and type, map its fields, and set how it charts.</td><td><a href="/pages/UlZ0vwT23WaSlpB6ae7r">/pages/UlZ0vwT23WaSlpB6ae7r</a></td></tr><tr><td><strong>How to add and edit cards</strong></td><td>Parent how-to for shared card mechanics: toolbar, details panel, colours, and headers.</td><td><a href="/pages/DI00pTOdaJmOwltHKgIa">/pages/DI00pTOdaJmOwltHKgIa</a></td></tr><tr><td><strong>How to choose a metric type</strong></td><td>Pick between Number, Series, and Comparison for what you want to show.</td><td><a href="/pages/exJ4wHPtNqRHjfhSG9Y1">/pages/exJ4wHPtNqRHjfhSG9Y1</a></td></tr><tr><td><strong>How to add and manage lanes</strong></td><td>Add a lane to hold your metric cards, or any other lane type.</td><td><a href="/pages/cEW7pumNPGKdJ65EEAz7">/pages/cEW7pumNPGKdJ65EEAz7</a></td></tr><tr><td><strong>How to bulk edit cards</strong></td><td>Select multiple cards and apply tags, personas, or colour in one go.</td><td><a href="/pages/D239Y2x0Gzcz0VuWHA1p">/pages/D239Y2x0Gzcz0VuWHA1p</a></td></tr></tbody></table>


---

# Agent Instructions
This documentation is published with GitBook. GitBook is the documentation platform designed so that both humans and AI agents can read, navigate, and reason over technical content effectively. Learn more at gitbook.com.

## Querying This Documentation
If you need additional information that is not directly available in this page, you can query the documentation dynamically by asking a question.

Perform an HTTP GET request on the current page URL with the `ask` query parameter, and the optional `goal` query parameter:

```
GET https://helpdesk.smaply.app/journey-maps/cards/how-to-use-metric-cards.md?ask=<question>&goal=<endgoal>
```

`ask` is the immediate question: it should be specific, self-contained, and written in natural language.
`goal` is optional and describes the broader end goal you are ultimately trying to accomplish on behalf of the user. GitBook uses it to tailor the answer towards what is most useful for that goal.

The response will contain a direct answer to the question and relevant excerpts and sources from the documentation.

Use this mechanism when the answer is not explicitly present in the current page, you need clarification or additional context, or you want to retrieve related documentation sections.