> For the complete documentation index, see [llms.txt](https://helpdesk.smaply.app/llms.txt). Markdown versions of documentation pages are available by appending `.md` to page URLs; this page is available as [Markdown](https://helpdesk.smaply.app/journey-maps/lanes/how-to-use-emotion-chart-lanes.md).

# How to use emotion chart lanes

An emotion chart lane plots how sentiment rises and falls across the steps of a journey, as a curve with a data point at each step. Set the points and you have the emotional arc of the experience in one row, alongside the actions and touchpoints that drive it.

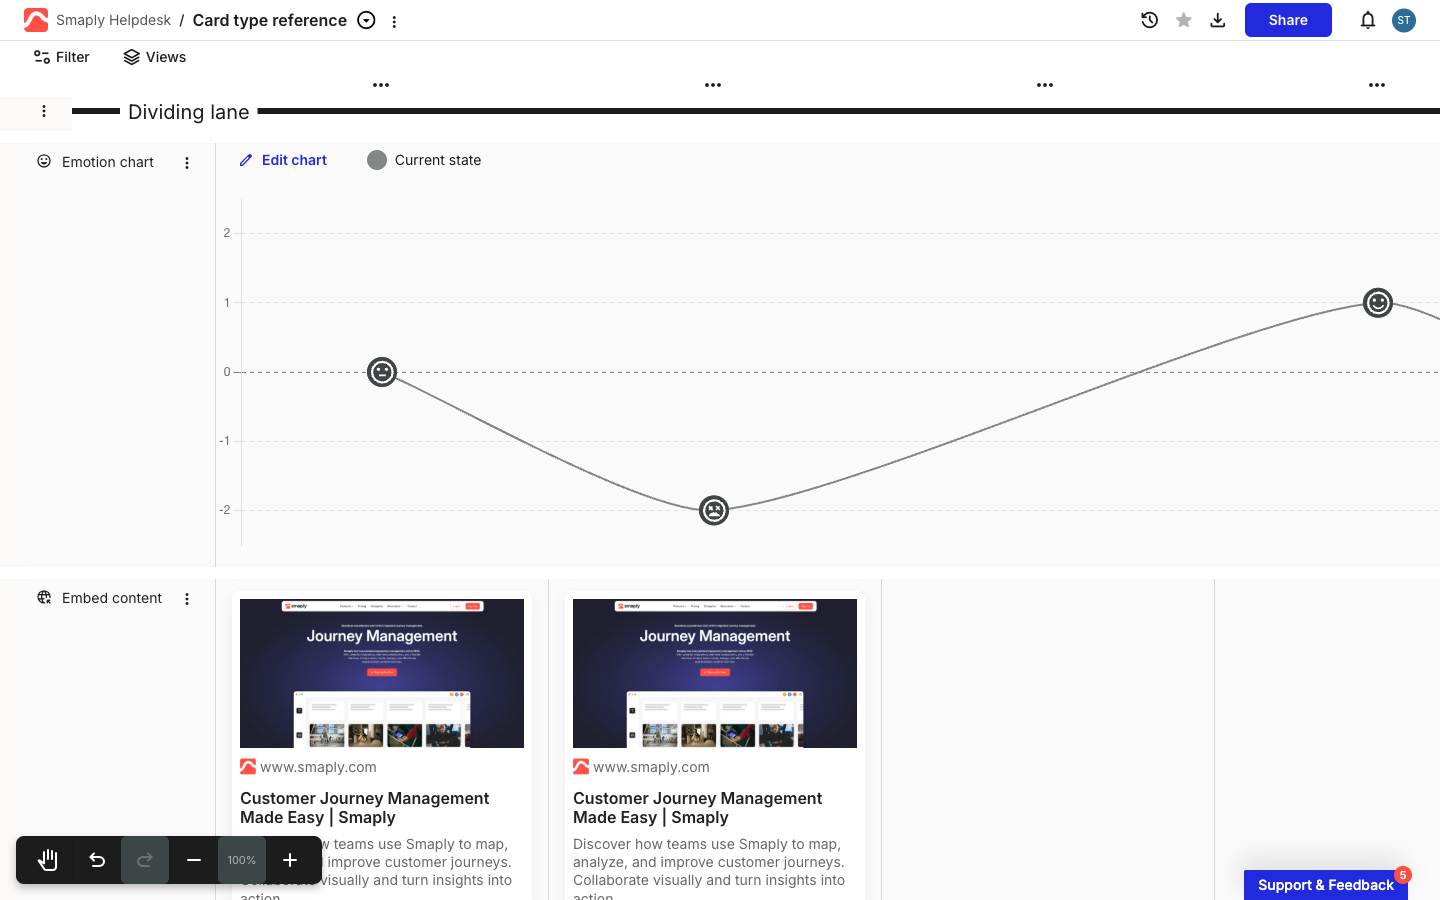
<figure><img src="/files/Xqg4CDPqd9GQPKLpFtfI" alt="A journey map editor with an Emotion chart lane. Inside the lane, a blue Edit chart link and a Current state legend sit above a sentiment curve plotted on a vertical scale marked 2, 1, 0, -1, -2. Round face icons mark the data point at each step: a neutral face near 0, a frowning face at -2, and a smiling face near +1, joined by a continuous line."><figcaption><p>The lane plots a sentiment curve across the journey steps</p></figcaption></figure>

To add one, hover an empty spot below a lane, click **+ Add lane**, and choose **Emotion chart** under **BASIC LANES**. The shared add-and-manage steps are covered in [How to add and manage lanes](/journey-maps/lanes/how-to-add-and-manage-lanes.md); this article covers what's specific to the emotion chart.

An emotion chart lane holds the sentiment curve, not cards. Its three-dot menu drops the card and clipboard actions other lanes have, and adds **Edit scale** for the points on the vertical axis.

***

#### How the chart reads

Each step has a data point, and the points join into a continuous line. Drag a point up or down to change the sentiment at that step. The face icon on the point updates to match the value, so a glance at the curve shows where the experience peaks and where it dips.

You don't have to set every step. Leave a point blank and the line interpolates across the gap, drawing straight through to the next point you've set rather than breaking the curve.

***

#### How to add and assign emotion lines

A line is one sentiment curve. A lane can hold as many lines as you like, so you can compare how several personas experience the same journey, or track sentiment against a custom benchmark. New lanes start with one line.

Click **Edit chart** in the lane to open the line list. Each line shows its colour, its name, and controls to rename or delete it. The two buttons at the bottom add a new line.

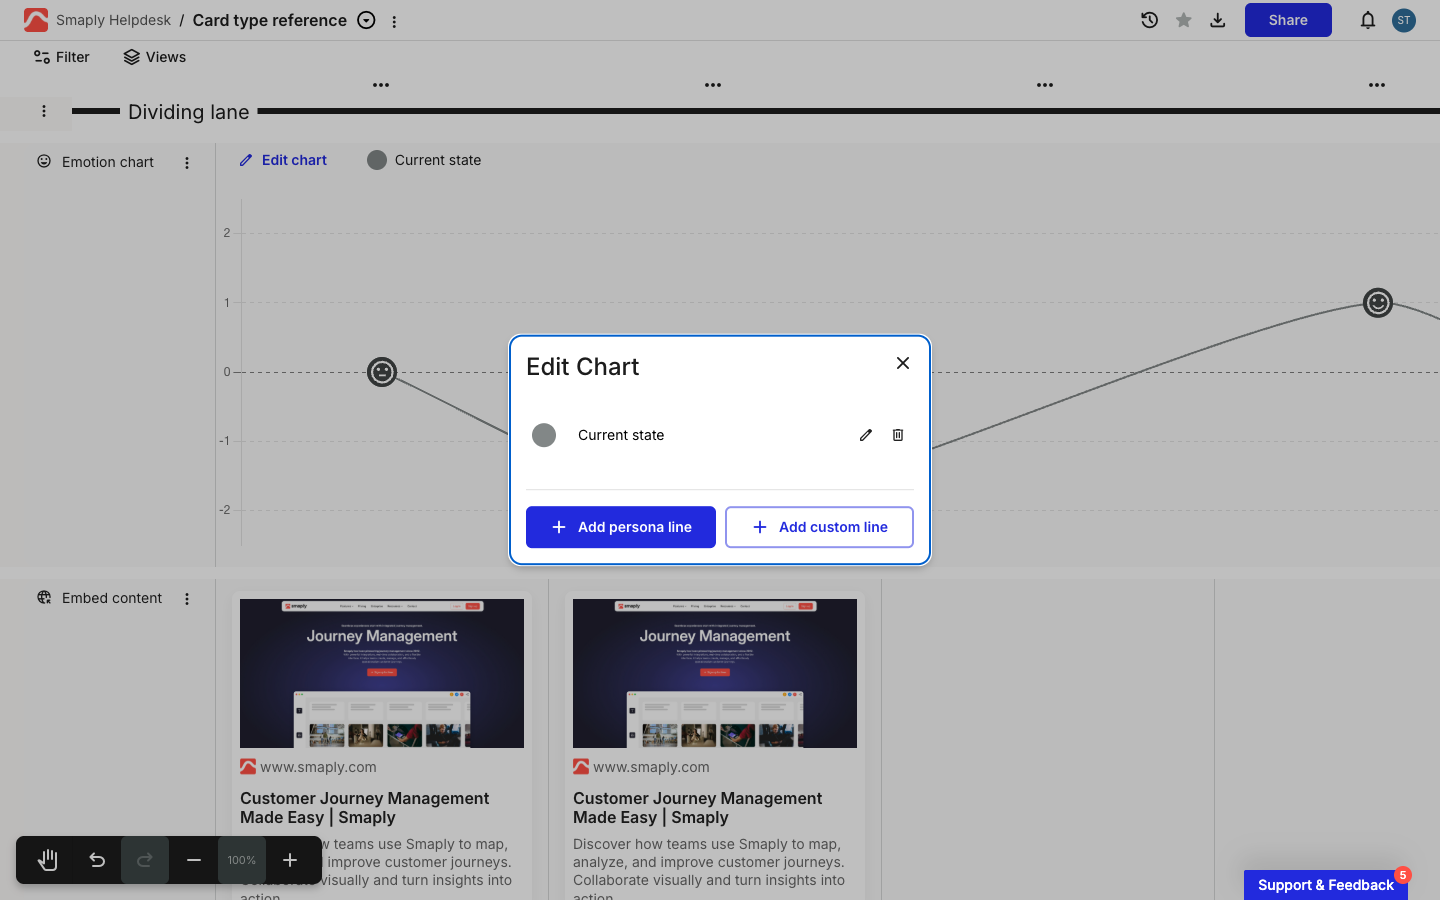
<figure><img src="/files/y8q9qc520Hlk1FXJWbuE" alt="An Edit Chart panel listing one line, Current state, with a grey colour dot, an edit pencil, and a delete icon. Two buttons sit below: a filled Add persona line button and an outlined Add custom line button."><figcaption><p>Edit Chart: the line list, with buttons to add a persona or custom line</p></figcaption></figure>

* **Add persona line** - Pick a persona from your workspace. The line takes that persona's name and colour, which ties the curve to who it represents.
* **Add custom line** - Name and colour the line yourself, for sentiment that isn't tied to a single persona, like a target curve or an aggregate.

The two kinds convert into each other from the line's edit controls, so a custom line can become a persona line later, and the reverse.

{% hint style="info" icon="user-group" %}
A persona line on the chart is independent of the personas you assign to cards. Adding a persona line here doesn't assign that persona to any card, and assigning a persona to a card doesn't add a line. To assign personas to cards, see [How to assign a persona to a card](/personas/how-to-assign-a-persona-to-a-card.md).
{% endhint %}

For a strategic example, here's using an emotion line to contrast current and future state on one map:

{% embed url="<https://www.loom.com/share/67bcd20749984c31aef97bdea3f928b0>" %}

***

#### How to set the sentiment scale

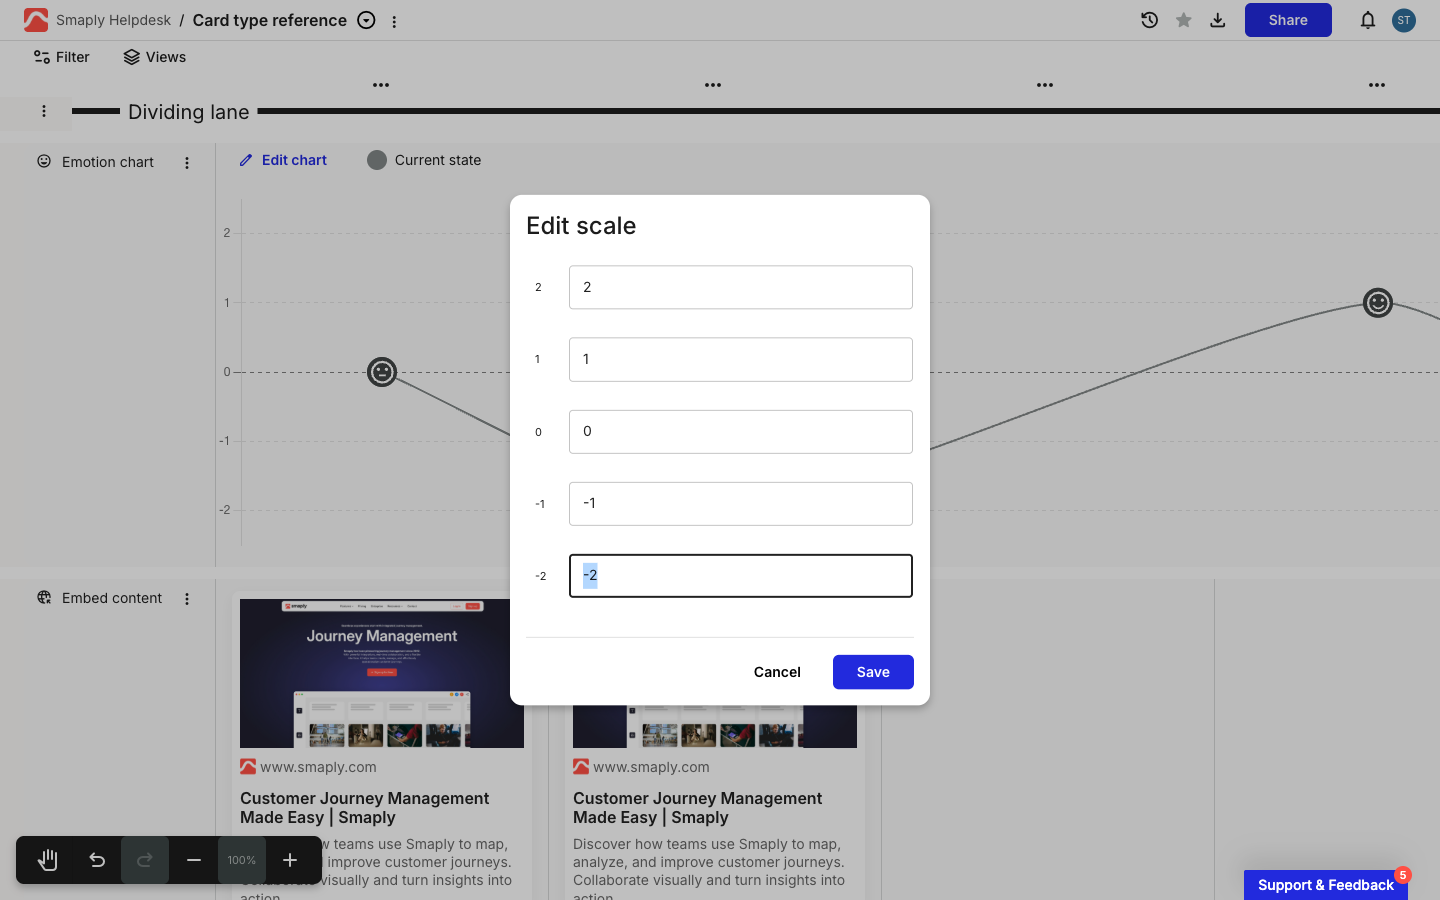
The vertical scale has five points, set to +2 at the top down to -2 by default, with 0 as the neutral midpoint. You can't add or remove points, but the value shown at each point is customizable: replace the default numbers with your own numbers, or with words, for example **Delighted**, **Satisfied**, **Neutral**, **Frustrated**, and **Angry**.

{% stepper %}
{% step %}
**Open Edit scale**

Click the lane's three-dot menu and select **Edit scale**.
{% endstep %}

{% step %}
**Relabel the points**

Each of the five points has a text field pre-filled with its number. Edit any of them to a number, word, or phrase that fits your scale, then click **Save**.

<figure><img src="/files/1gAhzg6CSfOje7rO9osZ" alt="An Edit scale modal with five rows. Each row shows a fixed scale point on the left (2, 1, 0, -1, -2) next to an editable text field pre-filled with that number. Cancel and Save buttons sit at the bottom right."><figcaption><p>Edit scale: relabel each of the five fixed points</p></figcaption></figure>
{% endstep %}
{% endstepper %}

The labels you set apply to every line in the lane.

***

#### Related topics

<table data-column-title-hidden data-view="cards"><thead><tr><th>Title</th><th>Description</th><th data-hidden data-card-target data-type="content-ref">Target</th></tr></thead><tbody><tr><td><strong>How to add and manage lanes</strong></td><td>Add an emotion chart lane, and the shared mechanics for reordering, pinning, and removing lanes.</td><td><a href="/pages/cEW7pumNPGKdJ65EEAz7">/pages/cEW7pumNPGKdJ65EEAz7</a></td></tr><tr><td><strong>How to manage personas</strong></td><td>Create and edit the personas you plot as lines on the chart.</td><td><a href="/pages/oScEAxHrtqqY2twvz5kM">/pages/oScEAxHrtqqY2twvz5kM</a></td></tr><tr><td><strong>How to assign a persona to a card</strong></td><td>Tag cards with a persona, which is separate from charting a persona line here.</td><td><a href="/pages/42b6nVolnvr4VE3kfJ6s">/pages/42b6nVolnvr4VE3kfJ6s</a></td></tr><tr><td><strong>How to use grid lanes</strong></td><td>Another structured lane type: a grid of named rows that hold cards.</td><td><a href="/pages/lZD6w7ZNrPaXH8F0kQNn">/pages/lZD6w7ZNrPaXH8F0kQNn</a></td></tr></tbody></table>


---

# Agent Instructions
This documentation is published with GitBook. GitBook is the documentation platform designed so that both humans and AI agents can read, navigate, and reason over technical content effectively. Learn more at gitbook.com.

## Querying This Documentation
If you need additional information that is not directly available in this page, you can query the documentation dynamically by asking a question.

Perform an HTTP GET request on the current page URL with the `ask` query parameter, and the optional `goal` query parameter:

```
GET https://helpdesk.smaply.app/journey-maps/lanes/how-to-use-emotion-chart-lanes.md?ask=<question>&goal=<endgoal>
```

`ask` is the immediate question: it should be specific, self-contained, and written in natural language.
`goal` is optional and describes the broader end goal you are ultimately trying to accomplish on behalf of the user. GitBook uses it to tailor the answer towards what is most useful for that goal.

The response will contain a direct answer to the question and relevant excerpts and sources from the documentation.

Use this mechanism when the answer is not explicitly present in the current page, you need clarification or additional context, or you want to retrieve related documentation sections.