> For the complete documentation index, see [llms.txt](https://helpdesk.smaply.app/llms.txt). Markdown versions of documentation pages are available by appending `.md` to page URLs; this page is available as [Markdown](https://helpdesk.smaply.app/metrics/how-to-create-and-configure-a-metric.md).

# How to create and configure a metric

A metric turns a number, a trend, or a before-and-after comparison into something you can drop onto a journey map. Create one from manual data you enter yourself, or from a tool you've connected at the account level, then preview it and save.

{% hint style="warning" icon="list-check" %}

#### Prerequisites

* Editor role at the workspace level
* A data source. Manual data needs no setup. To pull from Google Analytics, Power BI, Excel (Office 365), Google Sheet, or Qualtrics, that tool must be connected first. See [How to manage integrations](/integrations/how-to-manage-integrations-at-account-level.md).
  {% endhint %}

#### Add a metric

You can start a metric from two places. Both open the same full-page **Add metric** builder.

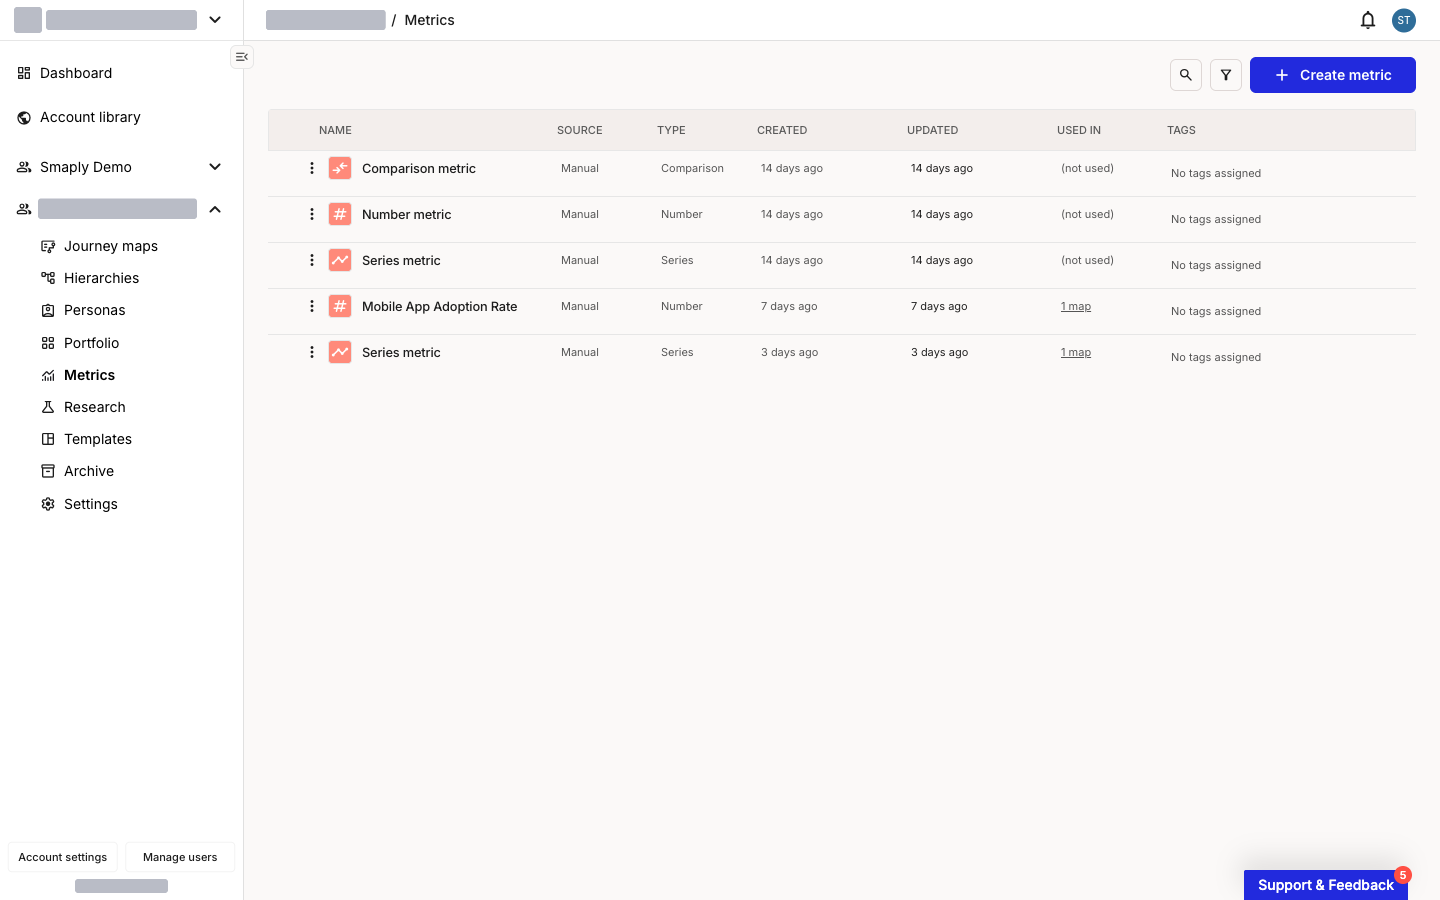
* **From the workspace Metrics tab** - Click **Metrics** in the workspace sidebar, then **+ Create metric** in the top right.
* **From a journey map** - Hover in a lane, click **+ Add card**, and pick **Metric**. You can choose an existing metric or type a name to build a new one.

<figure><img src="/files/rbQks9UgPpJlBqP2xgGh" alt="The workspace Metrics tab listing saved metrics in a table with Name, Source, Type, Created, Updated, Used in, and Tags columns. A Create metric button sits in the top right."><figcaption><p>The workspace Metrics tab, with Create metric top right</p></figcaption></figure>

{% hint style="warning" %}

#### **Important: fields unlock in order, and Save stays disabled until you preview**

The builder reveals fields one at a time: **Name** unlocks **Source**, **Source** unlocks **Type**, and **Type** reveals the data section and the **Show Preview** button. **Save** stays greyed out until you click **Show Preview**. If Save looks disabled, you haven't previewed yet.
{% endhint %}

{% stepper %}
{% step %}
**Open the metric builder**

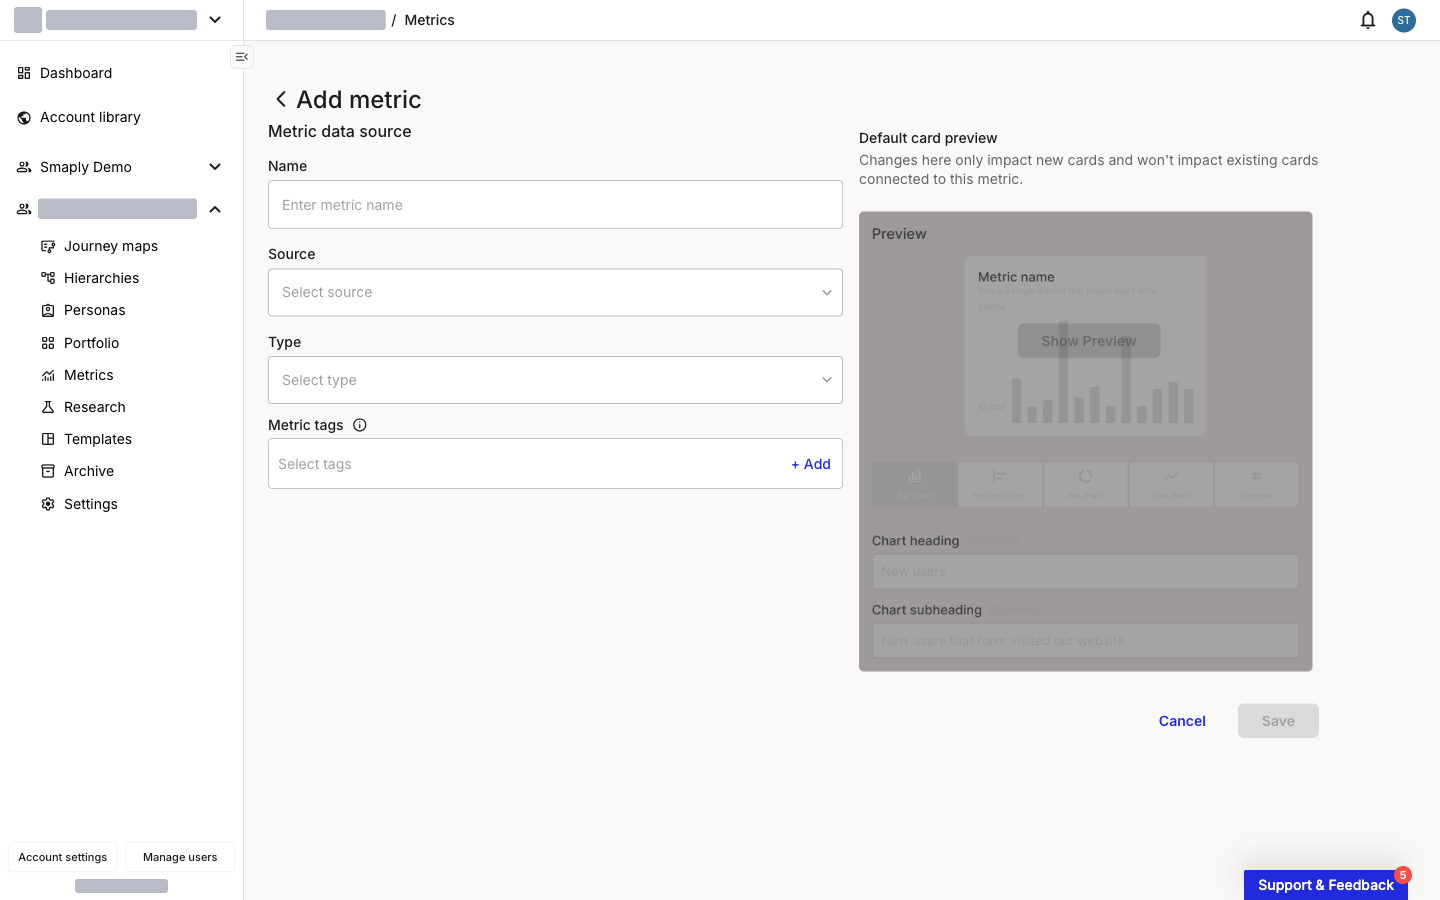
Use either entry point above. The **Add metric** page opens with the **Metric data source** fields on the left and a **Default card preview** on the right.

<figure><img src="/files/4tyGi4FhXkzKOmNqKiwh" alt="The Add metric page. The left column shows the Metric data source section with empty Name, Source, Type, and Metric tags fields. The right column shows the Default card preview panel with a Show Preview button over a sample chart."><figcaption><p>Add metric, empty</p></figcaption></figure>
{% endstep %}

{% step %}
**Enter a Name**

Type a name in the **Name** field, such as `Website signups`. This is how the metric appears in the Metrics list and in the metric picker when you add it to a map.
{% endstep %}

{% step %}
**Pick a Source**

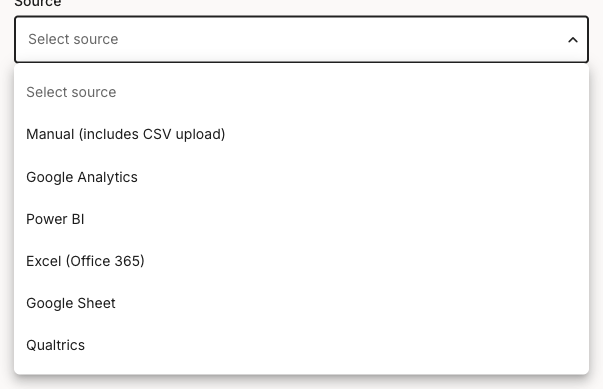
Open the **Source** dropdown and choose where the data comes from.

<figure><img src="/files/dWYPzquO1YWgtr2YD7hQ" alt="The Source dropdown open, listing Manual (includes CSV upload), Google Analytics, Power BI, Excel (Office 365), Google Sheet, and Qualtrics."><figcaption><p>Source options</p></figcaption></figure>

* **Manual (includes CSV upload)** - Enter values yourself, paste a table, or upload a CSV. No connection needed. See [How to use manual metrics with CSV](/metrics/how-to-use-manual-metrics-with-csv.md).
* **A connected tool** - Google Analytics, Power BI, Excel (Office 365), Google Sheet, or Qualtrics. These appear only after an Admin connects them. See the tool's setup guide, for example [How to set up the Power BI integration](/integrations/metrics-tools/power-bi/how-to-set-up-the-power-bi-integration.md), and [How to manage integrations](/integrations/how-to-manage-integrations-at-account-level.md).
  {% endstep %}

{% step %}
**Pick a Type**

Open the **Type** dropdown and choose **Series**, **Number**, or **Comparison**. The type sets what the metric measures and how it renders, and it determines the data fields shown in the next step.

<figure><img src="/files/lJKk4YOlBsdeSw1xW5pa" alt="The Type dropdown open, showing Series, Number, and Comparison options, each with a small leading icon."><figcaption><p>Metric types</p></figcaption></figure>

For help deciding, see [How to choose a metric type](/metrics/how-to-choose-a-metric-type.md).
{% endstep %}

{% step %}
**Enter or configure the data**

The data section matches your type. **Series** gives you a Label and Value table you can fill in, paste into, or populate from a CSV. **Number** takes a single value with optional prefix and suffix. **Comparison** takes a current and previous value. For a connected tool, this section is where you map the source fields instead.
{% endstep %}

{% step %}
**Click Show Preview**

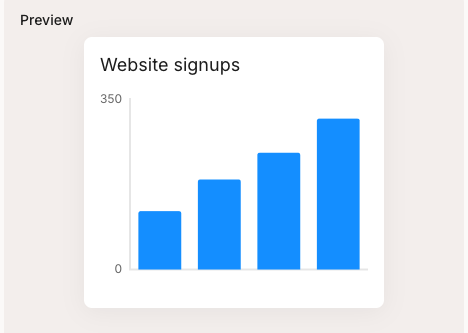
Click **Show Preview** in the **Default card preview** panel. The sample chart renders with your data and the full **Options** panel appears below it. This step also enables **Save**.

<figure><img src="/files/TlFhbsiuEEdexwL9GAVB" alt="The Default card preview showing a rendered Series bar chart titled Website signups, with four ascending blue bars and a vertical axis running from 0 to 350."><figcaption><p>Preview of a Series metric</p></figcaption></figure>
{% endstep %}

{% step %}
**Adjust the chart and display options**

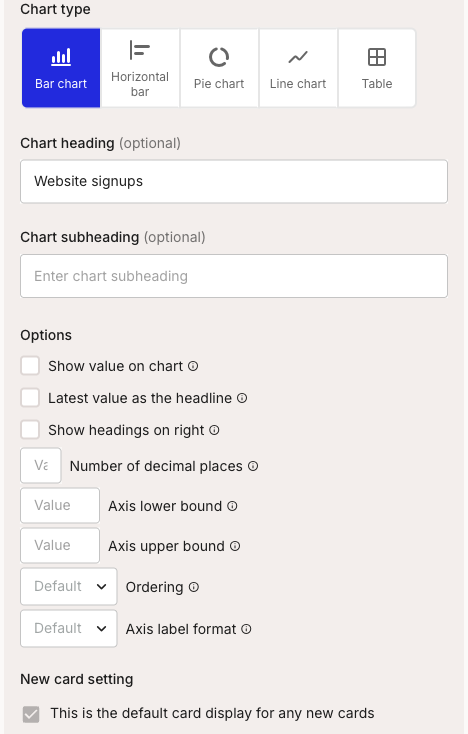
Set how the card looks in the **Options** panel. Pick a chart type, add an optional heading and subheading, and adjust display details like decimal places and axis bounds.

<figure><img src="/files/wEfjfALiso4Stv3mUCJ8" alt="The Options panel for a Series metric. A Chart type row offers Bar chart, Horizontal bar, Pie chart, Line chart, and Table. Below are Chart heading and Chart subheading fields, then options for showing values, decimal places, and axis bounds."><figcaption><p>Chart and display options</p></figcaption></figure>
{% endstep %}

{% step %}
**Save**

Click **Save**. The metric joins the Metrics list and is ready to add to any journey map in the workspace.
{% endstep %}
{% endstepper %}

For worked examples, here's building a Number metric and a Comparison metric:

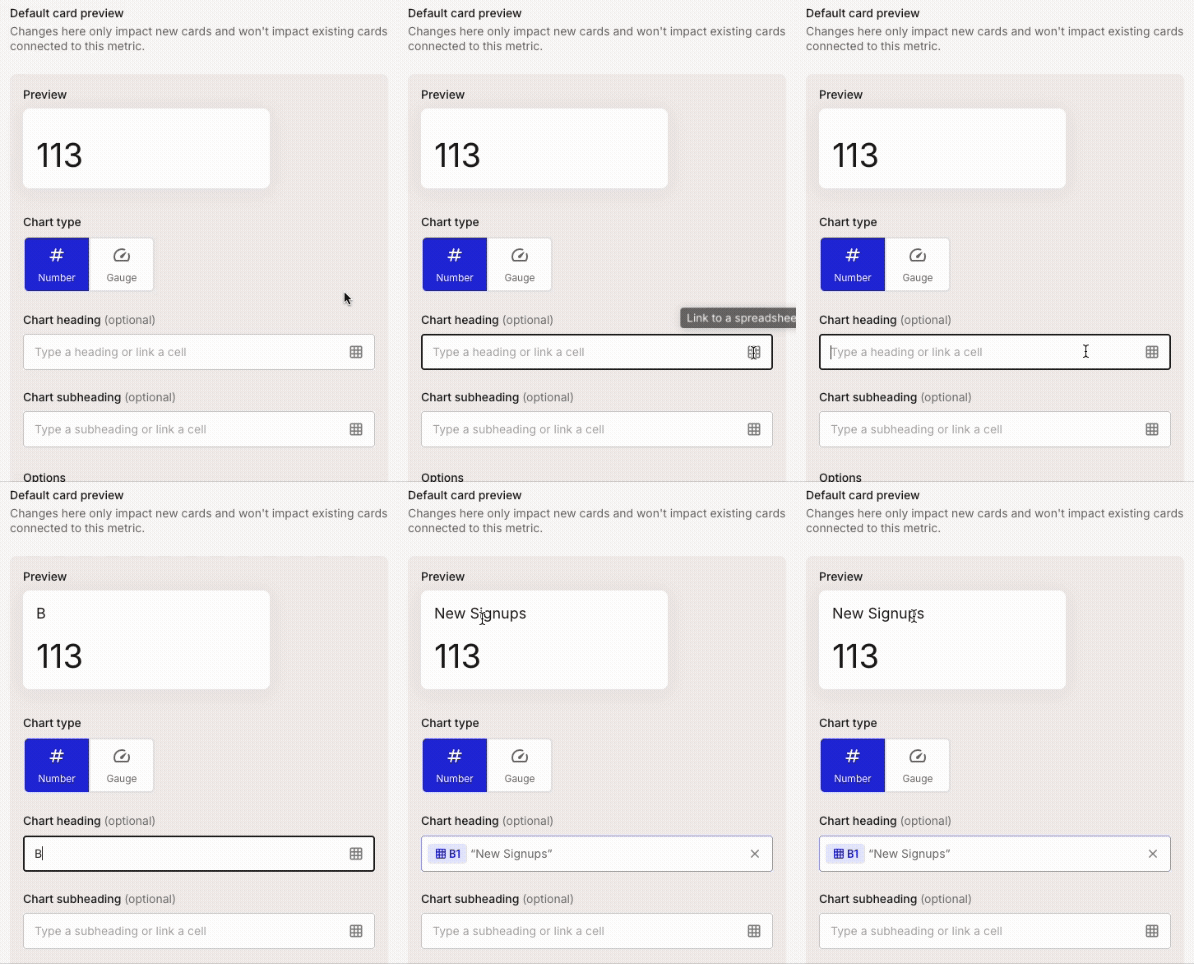
{% embed url="<https://files.gitbook.com/v0/b/gitbook-x-prod.appspot.com/o/spaces%2For99xDEElfps9uMDY60K%2Fuploads%2FVpLMhO1wopakt9zvo42U%2Fcreate_number.mp4?alt=media&token=9c277dab-6c33-44aa-9939-9e8a217c382f>" %}

{% embed url="<https://files.gitbook.com/v0/b/gitbook-x-prod.appspot.com/o/spaces%2For99xDEElfps9uMDY60K%2Fuploads%2FdqSIEMjUp8krhnv6utZE%2Fcreate_comparison.mp4?alt=media&token=c75f240f-2a67-41ab-bff6-e22a56bb9028>" %}

#### Configure the card display

The **Default card preview** panel on the right sets how a new card looks by default. Pick the chart type and fill in the heading and subheading, and the preview updates in real time.

Defaults set here apply only to new cards. Editing them later does not change cards already placed on a map. To change how a single card looks on a specific map, edit that card directly. See [How to use metric cards](/journey-maps/cards/how-to-use-metric-cards.md).

#### Troubleshooting

<details>

<summary><strong>The Save button is greyed out</strong> - Preview not generated</summary>

Save stays disabled until the metric has been previewed. Click **Show Preview** in the **Default card preview** panel. Once the chart renders, Save becomes active.

</details>

<details>

<summary><strong>The Source or Type dropdown is greyed out</strong> - Earlier field not set</summary>

The fields unlock in order. **Source** stays locked until the **Name** field has a value, and **Type** stays locked until a **Source** is selected. Fill in each field from the top down.

</details>

<details>

<summary><strong>The preview shows no data</strong> - Data not entered or source not returning values</summary>

For a Manual metric, check that you've entered values in the data section before previewing. For a connected tool, confirm the source fields are mapped and the integration is still connected. If a tool that worked before has stopped returning data, see [How to manage integrations](/integrations/how-to-manage-integrations-at-account-level.md).

</details>

#### Related topics

<table data-column-title-hidden data-view="cards"><thead><tr><th>Article</th><th>What it covers</th><th data-hidden data-card-target data-type="content-ref">Target</th></tr></thead><tbody><tr><td><strong>How to choose a metric type</strong></td><td>Decide between Series, Number, and Comparison.</td><td><a href="/pages/exJ4wHPtNqRHjfhSG9Y1">/pages/exJ4wHPtNqRHjfhSG9Y1</a></td></tr><tr><td><strong>How to use manual metrics with CSV</strong></td><td>Enter, paste, or upload your own data without an integration.</td><td><a href="/pages/S51TFnU5zyHLVAwsRNUD">/pages/S51TFnU5zyHLVAwsRNUD</a></td></tr><tr><td><strong>How to use metric cards</strong></td><td>Add a metric to a journey map and adjust how it displays per card.</td><td><a href="/pages/598LDg8aKf90gVjRC9GG">/pages/598LDg8aKf90gVjRC9GG</a></td></tr><tr><td><strong>How to manage integrations</strong></td><td>Connect, disconnect, and switch the tools that feed your metrics.</td><td><a href="/pages/eVJNZWbpULcbx2YE06fQ">/pages/eVJNZWbpULcbx2YE06fQ</a></td></tr></tbody></table>


---

# Agent Instructions
This documentation is published with GitBook. GitBook is the documentation platform designed so that both humans and AI agents can read, navigate, and reason over technical content effectively. Learn more at gitbook.com.

## Querying This Documentation
If you need additional information that is not directly available in this page, you can query the documentation dynamically by asking a question.

Perform an HTTP GET request on the current page URL with the `ask` query parameter, and the optional `goal` query parameter:

```
GET https://helpdesk.smaply.app/metrics/how-to-create-and-configure-a-metric.md?ask=<question>&goal=<endgoal>
```

`ask` is the immediate question: it should be specific, self-contained, and written in natural language.
`goal` is optional and describes the broader end goal you are ultimately trying to accomplish on behalf of the user. GitBook uses it to tailor the answer towards what is most useful for that goal.

The response will contain a direct answer to the question and relevant excerpts and sources from the documentation.

Use this mechanism when the answer is not explicitly present in the current page, you need clarification or additional context, or you want to retrieve related documentation sections.