> For the complete documentation index, see [llms.txt](https://helpdesk.smaply.app/llms.txt). Markdown versions of documentation pages are available by appending `.md` to page URLs; this page is available as [Markdown](https://helpdesk.smaply.app/metrics/how-to-use-manual-metrics-with-csv.md).

# How to use manual metrics with CSV

Manual is the source to reach for when your data isn't in a connected tool. It needs no integration setup, supports all three metric types, and lets you bring data in by CSV upload, by pasting from a spreadsheet, or by typing values directly. In the **Source** dropdown it's labelled **Manual (includes CSV upload)**.

{% hint style="warning" icon="list-check" %}

#### Prerequisites

You need an Editor role at the workspace level. No integration setup is required.
{% endhint %}

#### Add a manual metric

The full builder flow (both entry points, the preview, and the card options) is covered in [How to create and configure a metric](/metrics/how-to-create-and-configure-a-metric.md). The steps below focus on what's specific to the Manual source: choosing it and getting your data in.

{% stepper %}
{% step %}
**Open the metric builder and enter a Name**

Start a new metric and give it a **Name**. The **Name** unlocks the **Source** field. See [How to create and configure a metric](/metrics/how-to-create-and-configure-a-metric.md) for the two ways to open the builder.
{% endstep %}

{% step %}
**Pick Source = Manual (includes CSV upload)**

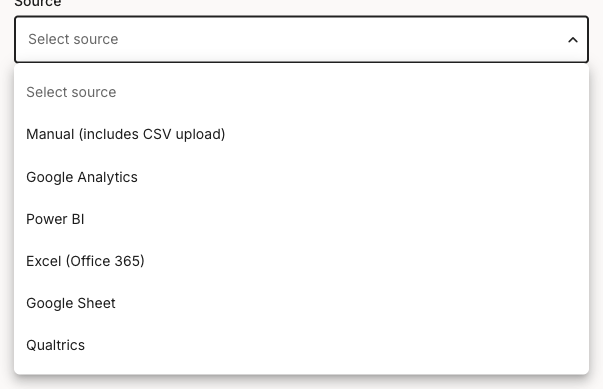
In the **Source** dropdown, select **Manual (includes CSV upload)**. It's the first option and the only source that needs no connection.

<figure><img src="/files/dWYPzquO1YWgtr2YD7hQ" alt="The Source dropdown open in the metric builder, listing Manual (includes CSV upload) first, followed by Google Analytics, Power BI, Excel (Office 365), Google Sheet, and Qualtrics."><figcaption><p>Source dropdown, Manual selected</p></figcaption></figure>
{% endstep %}

{% step %}
**Pick a Type**

Choose **Series**, **Number**, or **Comparison**. The type decides how you enter the data: Series uses a table you can fill by CSV, paste, or by hand; Number and Comparison take values you type inline. For help deciding, see [How to choose a metric type](/metrics/how-to-choose-a-metric-type.md).
{% endstep %}

{% step %}
**Enter your data**

Fill in the data for the type you picked. See [Enter your data](#enter-your-data) below for the per-type detail.
{% endstep %}

{% step %}
**Click Show Preview**

Click **Show Preview** to render the chart and reveal the full options panel.
{% endstep %}

{% step %}
**Adjust the options and Save**

Set the chart heading, decimals, and any other display options, then click **Save**. The metric appears in the workspace **Metrics** list.
{% endstep %}
{% endstepper %}

***

#### Enter your data

How you enter data depends on the metric type.

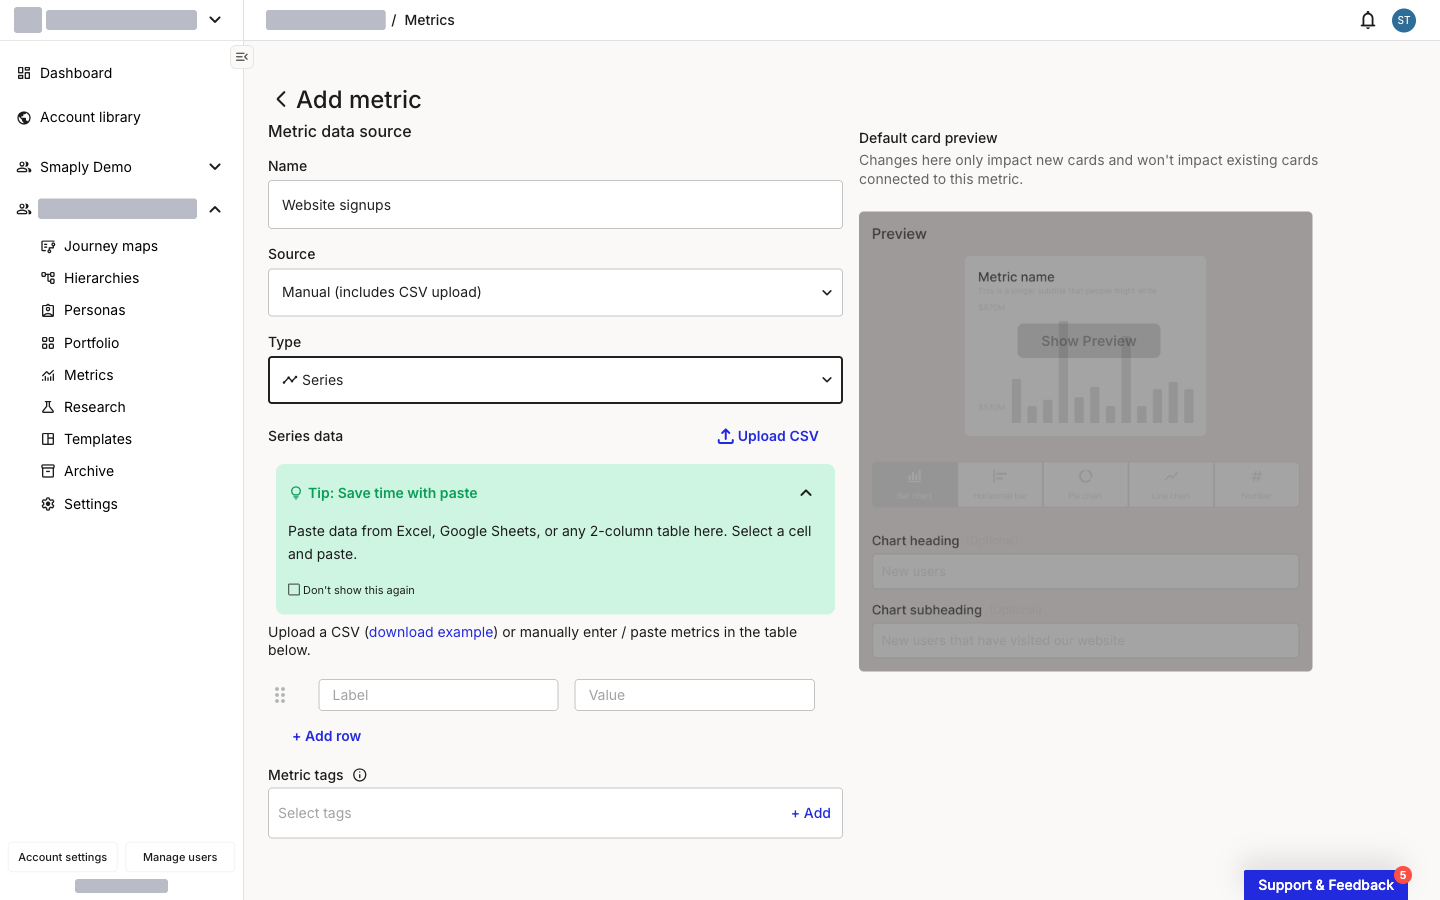
For a **Series** metric, the **Series data** section gives you three interchangeable ways to fill the **Label** / **Value** table. Use whichever fits the data you have.

<figure><img src="/files/aKPIAUAtJyJ6AdFhVFjW" alt="The Series data section of the metric builder with Source set to Manual. An Upload CSV button sits top-right, a green tip explains pasting from a spreadsheet, and helper text links a downloadable example above an empty Label and Value table with an Add row link."><figcaption><p>Series data: Upload CSV, paste, or the Label / Value table</p></figcaption></figure>

* **Upload CSV** - Click **Upload CSV** and choose your file. The CSV has two columns, **Label** and **Value** (for example, `Jan,120`). The **download example** link in the helper text gives you a template to fill in.
* **Paste from a spreadsheet** - Copy a two-column range from Excel or Google Sheets, click into the table, and paste. The rows fill in automatically.
* **Type rows by hand** - Enter a **Label** and **Value**, then click **+ Add row** for each data point. Drag the handle to reorder rows, or use the per-row delete to remove one.

{% hint style="success" icon="lightbulb" %}

#### **Tip: Paste straight from a spreadsheet**

Copy a two-column range from Excel or Google Sheets, select a cell in the table, and paste. There's no need to format the data first or save it as a file.
{% endhint %}

{% hint style="warning" %}

#### **Important: The CSV needs exactly two columns**

Use one column for the **Label** and one for the **Value** (`Jan,120`). The same two-column shape applies whether you upload a file or paste from a spreadsheet.
{% endhint %}

For a **Number** or **Comparison** metric, there's no table or CSV. You type the values directly into the builder:

* **Number** - Enter a **Prefix**, **Value**, and **Suffix** (for example, `$` `1,200` or `85` `%`).
* **Comparison** - Enter a **Prefix**, **Current** value, **Previous** value, and **Suffix**. The metric renders the two values with the percentage change between them.

***

#### Preview and save

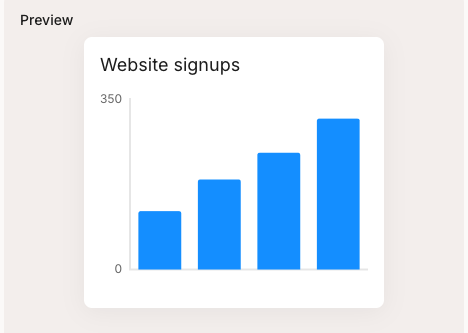
Once your data is in, click **Show Preview** to render the card and open the display options. For a Series metric, the preview shows the chart you've built.

<figure><img src="/files/TlFhbsiuEEdexwL9GAVB" alt="A rendered metric card titled Website signups showing a bar chart of four increasing bars on a 0 to 350 axis."><figcaption><p>Series card preview</p></figcaption></figure>

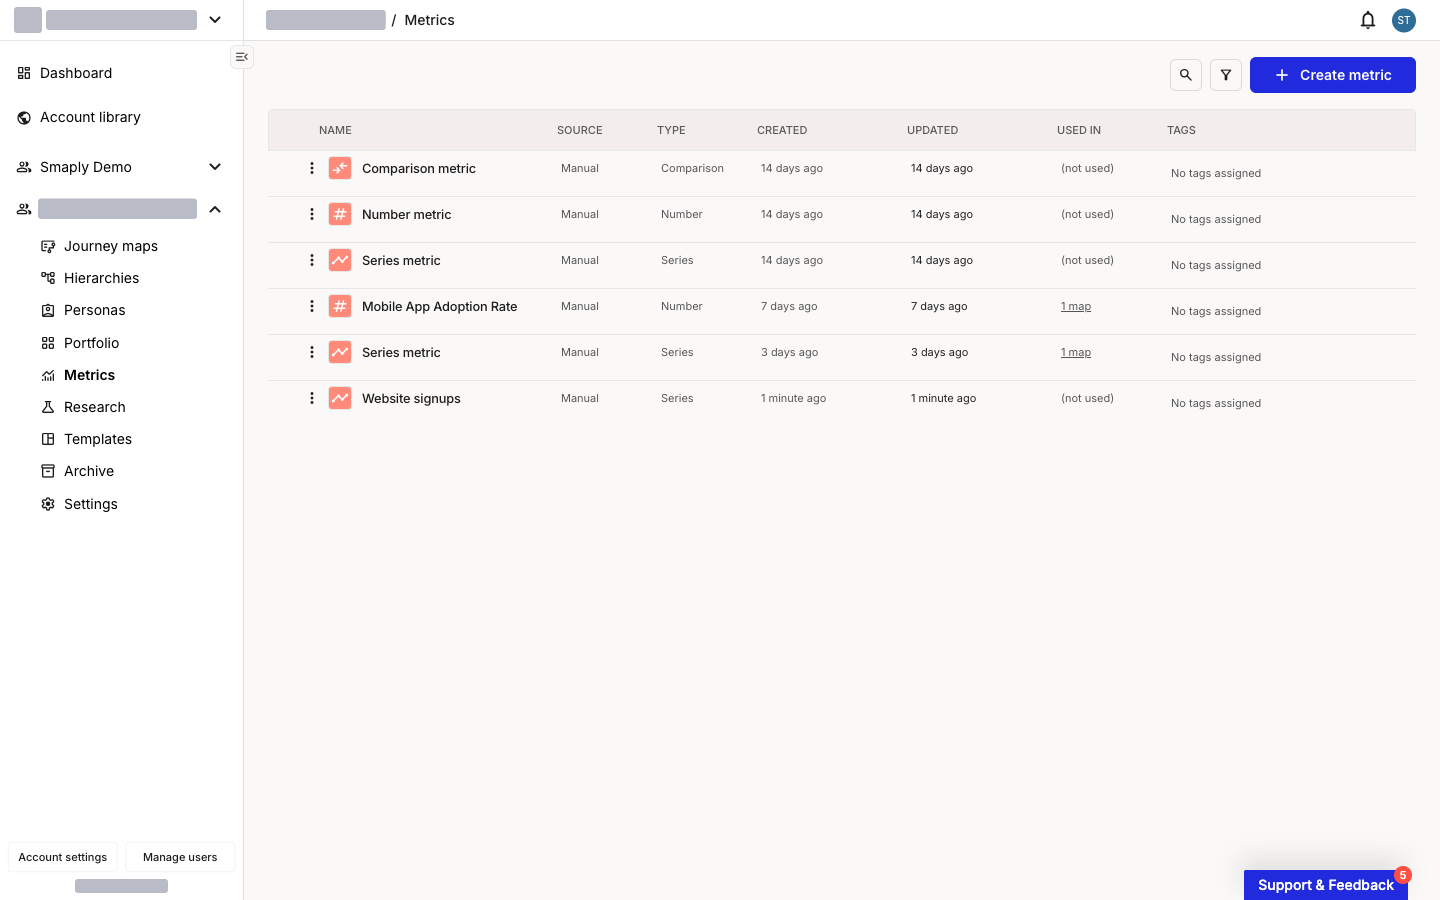
After you click **Save**, the metric appears in the workspace **Metrics** list with its source shown as **Manual**, ready to add to a journey map.

<figure><img src="/files/uuC0UWhFHNNwUvik0nBs" alt="The workspace Metrics list with a saved metric named Website signups at the top, its Source column reading Manual and its Type column reading Series."><figcaption><p>The saved metric in the Metrics list</p></figcaption></figure>

To put the metric on a journey map, see [How to use metric cards](/journey-maps/cards/how-to-use-metric-cards.md).

***

#### Troubleshooting

<details>

<summary><strong>CSV won't import</strong> - File shape issue</summary>

The file needs exactly two columns, **Label** and **Value**, with one data point per row (`Jan,120`). If your export has extra columns, header rows the builder doesn't expect, or merged cells, trim it down to two columns first. Use the **download example** link as a reference for the expected shape.

</details>

<details>

<summary><strong>Values aren't charting</strong> - Missing Label or Value</summary>

A Series chart needs a **Label** and a **Value** in each row. Rows with one cell filled and the other blank won't plot. Check that every row has both, then click **Show Preview** again to re-render.

</details>

<details>

<summary><strong>Save is greyed out</strong> - Preview not generated yet</summary>

**Save** stays disabled until you click **Show Preview**. Generating the preview renders the chart and unlocks the rest of the options, including **Save**.

</details>

#### Related topics

<table data-column-title-hidden data-view="cards"><thead><tr><th>Article</th><th>What it covers</th><th data-hidden data-card-target data-type="content-ref">Target</th></tr></thead><tbody><tr><td><strong>How to create and configure a metric</strong></td><td>The full builder flow, both entry points, preview, and card options.</td><td><a href="/pages/UlZ0vwT23WaSlpB6ae7r">/pages/UlZ0vwT23WaSlpB6ae7r</a></td></tr><tr><td><strong>How to choose a metric type</strong></td><td>When to use Series, Number, or Comparison, and how each one renders.</td><td><a href="/pages/exJ4wHPtNqRHjfhSG9Y1">/pages/exJ4wHPtNqRHjfhSG9Y1</a></td></tr><tr><td><strong>How to use metric cards</strong></td><td>Add a saved metric to a journey map and choose how it displays.</td><td><a href="/pages/598LDg8aKf90gVjRC9GG">/pages/598LDg8aKf90gVjRC9GG</a></td></tr></tbody></table>


---

# Agent Instructions
This documentation is published with GitBook. GitBook is the documentation platform designed so that both humans and AI agents can read, navigate, and reason over technical content effectively. Learn more at gitbook.com.

## Querying This Documentation
If you need additional information that is not directly available in this page, you can query the documentation dynamically by asking a question.

Perform an HTTP GET request on the current page URL with the `ask` query parameter, and the optional `goal` query parameter:

```
GET https://helpdesk.smaply.app/metrics/how-to-use-manual-metrics-with-csv.md?ask=<question>&goal=<endgoal>
```

`ask` is the immediate question: it should be specific, self-contained, and written in natural language.
`goal` is optional and describes the broader end goal you are ultimately trying to accomplish on behalf of the user. GitBook uses it to tailor the answer towards what is most useful for that goal.

The response will contain a direct answer to the question and relevant excerpts and sources from the documentation.

Use this mechanism when the answer is not explicitly present in the current page, you need clarification or additional context, or you want to retrieve related documentation sections.