> For the complete documentation index, see [llms.txt](https://helpdesk.smaply.app/llms.txt). Markdown versions of documentation pages are available by appending `.md` to page URLs; this page is available as [Markdown](https://helpdesk.smaply.app/portfolio/prioritization/how-to-use-the-portfolio-table.md).

# How to use the portfolio table

The **Table** lists every portfolio item in your workspace in one place, with scores, status, priority, and usage in columns you can sort and filter. Use it to compare items side by side and narrow down to the ones you want to act on.

#### How to open the Table

The Table is one of three views on the prioritization screen, alongside [Board](/portfolio/prioritization/how-to-use-the-portfolio-kanban.md) and [Chart](/portfolio/prioritization/how-to-use-the-portfolio-chart.md). Open it from the [Portfolio summary](/portfolio/how-to-use-the-portfolio-summary.md) in either of two ways:

* **View details** in the summary header opens the views screen.
* **Explore all** on any type card does the same, scoped to that type.

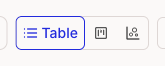
The views screen remembers the last view you used. If it opens on Board or Chart, click **Table** in the **Table / Board / Chart** switcher at the top right of the toolbar.

<figure><img src="/files/NQAegGkMJZSwxacI55gh" alt="The Table / Board / Chart view switcher. Table is selected and shows a text label; Board and Chart are icon-only."><figcaption><p>The view switcher, top right of the toolbar</p></figcaption></figure>

***

#### Reading the columns

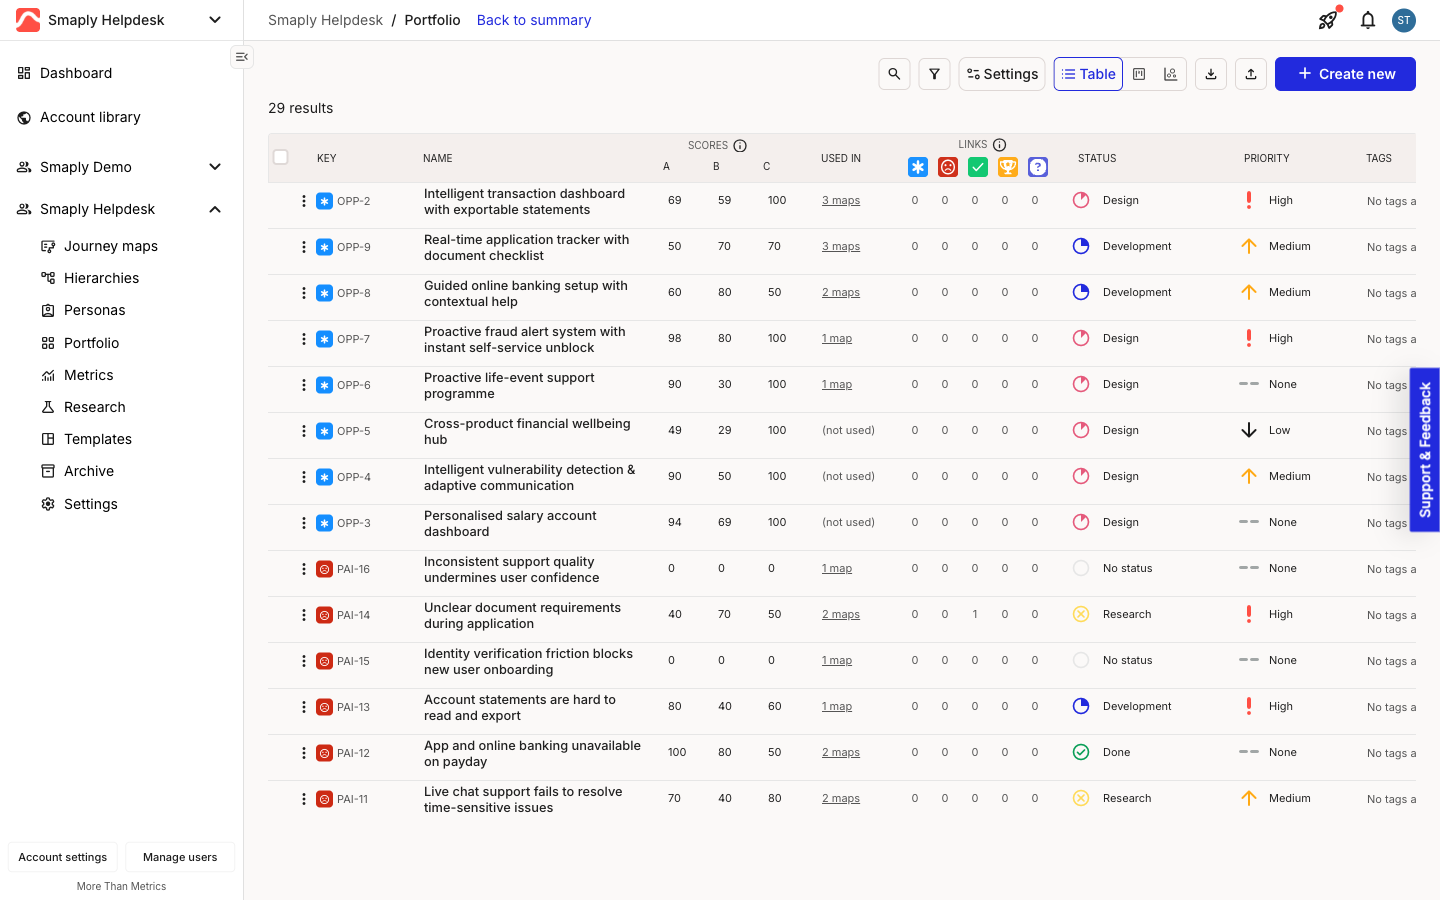
Each row is one portfolio item. The first column shows its **Name** with a type icon, so you can tell opportunities, pain points, solutions, and any custom types apart at a glance.

<figure><img src="/files/7LvGHa4GJoDCpP2QC5Vh" alt="The portfolio Table with 24 items in rows. Columns run from Name, through a SCORES group of three dimensions, Used in, a LINKS group, Status, Priority, Tags, and Updated. A 24 results count sits at the top left."><figcaption><p>The portfolio Table, populated</p></figcaption></figure>

Two column groups sit under shared headers:

* **SCORES** holds the three scoring dimensions for your items, shown here as Impact, Feasibility, and Reach. These names are set by an admin, so yours may read differently. The defaults are Impact, Reach, and Cost.
* **LINKS** breaks down how many other portfolio items each item is linked to, counted by type. Linking expresses relationships such as a pain point connected to the solution that addresses it. See [How to link portfolio items](/portfolio/how-to-link-portfolio-items.md).

**Used in** counts the journey maps that contain the item. It is clickable, which is how you find every map an item appears on without opening the item first. The remaining columns, **Status**, **Priority**, **Tags**, and **Updated**, hold the same values you set when you create or edit an item.

***

#### How to filter and sort the list

Click the filter icon in the toolbar to narrow the list. Each dimension expands to its own set of values, so you can combine filters, for example High priority items of one type that are still in progress.

<figure><img src="/files/6nvm4Plcqzn20DNYoaPn" alt="The filter menu open over the table, listing Journey map, Type, Status, Status category, Priority, Assignee, Tags, Updated, and Content source, each with a submenu arrow, and a Clear all option at the bottom."><figcaption><p>Filter dimensions</p></figcaption></figure>

You can filter by **Journey map**, **Type**, **Status**, **Status category**, **Priority**, **Assignee**, **Tags**, **Updated**, and **Content source**. Each one expands to a checklist of its values, so you tick the ones you want.

<figure><img src="/files/lTymRJiGu4aR23etJtuQ" alt="The table filter menu with the Status dimension expanded into a checklist of status values such as No status, Research, Not Started, Discarded, Design, Development, In Progress, Done, and Canceled."><figcaption><p>A filter dimension expanded to its values</p></figcaption></figure>

**Clear all** removes every filter at once. The result count at the top left updates as you go, so a filtered list reading "24 results" tells you how many items match.

To sort, click a column header. Sorting and filtering work together, so you can sort a filtered list, for example the highest-impact items assigned to one person.

***

#### How to choose which columns show

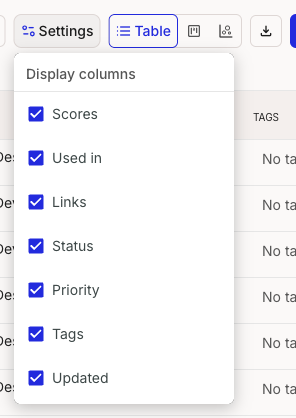
Click **Settings** in the toolbar to open **Display columns**, then toggle any of **Scores**, **Used in**, **Links**, **Status**, **Priority**, **Tags**, and **Updated**. Turn off the columns you do not need to focus the table on the ones you are comparing.

<figure><img src="/files/1uoTd07Fp98hTHeSspjm" alt="The Display columns menu open from Settings, with checkboxes for Scores, Used in, Links, Status, Priority, Tags, and Updated, all selected."><figcaption><p>Settings > Display columns</p></figcaption></figure>

#### How to export the table to CSV

The download icon on the toolbar, to the right of the view switcher, exports the list to a CSV file. Any filters you have applied carry through, so you can export the whole portfolio or just the slice you have narrowed to. For the full export flow, see [How to export portfolio to CSV](/portfolio/how-to-export-portfolio-to-csv.md).

***

#### Related topics

<table data-column-title-hidden data-view="cards"><thead><tr><th>Article</th><th>What it covers</th><th data-hidden data-card-target data-type="content-ref">Target</th></tr></thead><tbody><tr><td><strong>Use the portfolio chart</strong></td><td>Plot items on configurable axes for workshop-style prioritization.</td><td><a href="/pages/Bvvajkxb89h2CT9fR2mF">/pages/Bvvajkxb89h2CT9fR2mF</a></td></tr><tr><td><strong>Use the portfolio board</strong></td><td>Manage items in status-based columns.</td><td><a href="/pages/2QH7fPzYbtiQHUcNCPiK">/pages/2QH7fPzYbtiQHUcNCPiK</a></td></tr><tr><td><strong>Use the portfolio summary</strong></td><td>Scan volume, activity, and status across all item types.</td><td><a href="/pages/abuTV30fMWJUfseHuf1v">/pages/abuTV30fMWJUfseHuf1v</a></td></tr><tr><td><strong>Export portfolio to CSV</strong></td><td>Export the portfolio, or a filtered subset, for offline analysis.</td><td><a href="/pages/EWpdFIYYJJJqGy3W0gDt">/pages/EWpdFIYYJJJqGy3W0gDt</a></td></tr></tbody></table>


---

# Agent Instructions
This documentation is published with GitBook. GitBook is the documentation platform designed so that both humans and AI agents can read, navigate, and reason over technical content effectively. Learn more at gitbook.com.

## Querying This Documentation
If you need additional information that is not directly available in this page, you can query the documentation dynamically by asking a question.

Perform an HTTP GET request on the current page URL with the `ask` query parameter, and the optional `goal` query parameter:

```
GET https://helpdesk.smaply.app/portfolio/prioritization/how-to-use-the-portfolio-table.md?ask=<question>&goal=<endgoal>
```

`ask` is the immediate question: it should be specific, self-contained, and written in natural language.
`goal` is optional and describes the broader end goal you are ultimately trying to accomplish on behalf of the user. GitBook uses it to tailor the answer towards what is most useful for that goal.

The response will contain a direct answer to the question and relevant excerpts and sources from the documentation.

Use this mechanism when the answer is not explicitly present in the current page, you need clarification or additional context, or you want to retrieve related documentation sections.